A feature in Lumada Maintenance Insights to operationalize operator insights and evaluate performance at a coal mine.
My Role
I was the lead product designer in charge of all design and research work related. Worked closely with product management, engineers, business analysts, data scientists, and customer engagement team to meet deliveries.
The Challenge
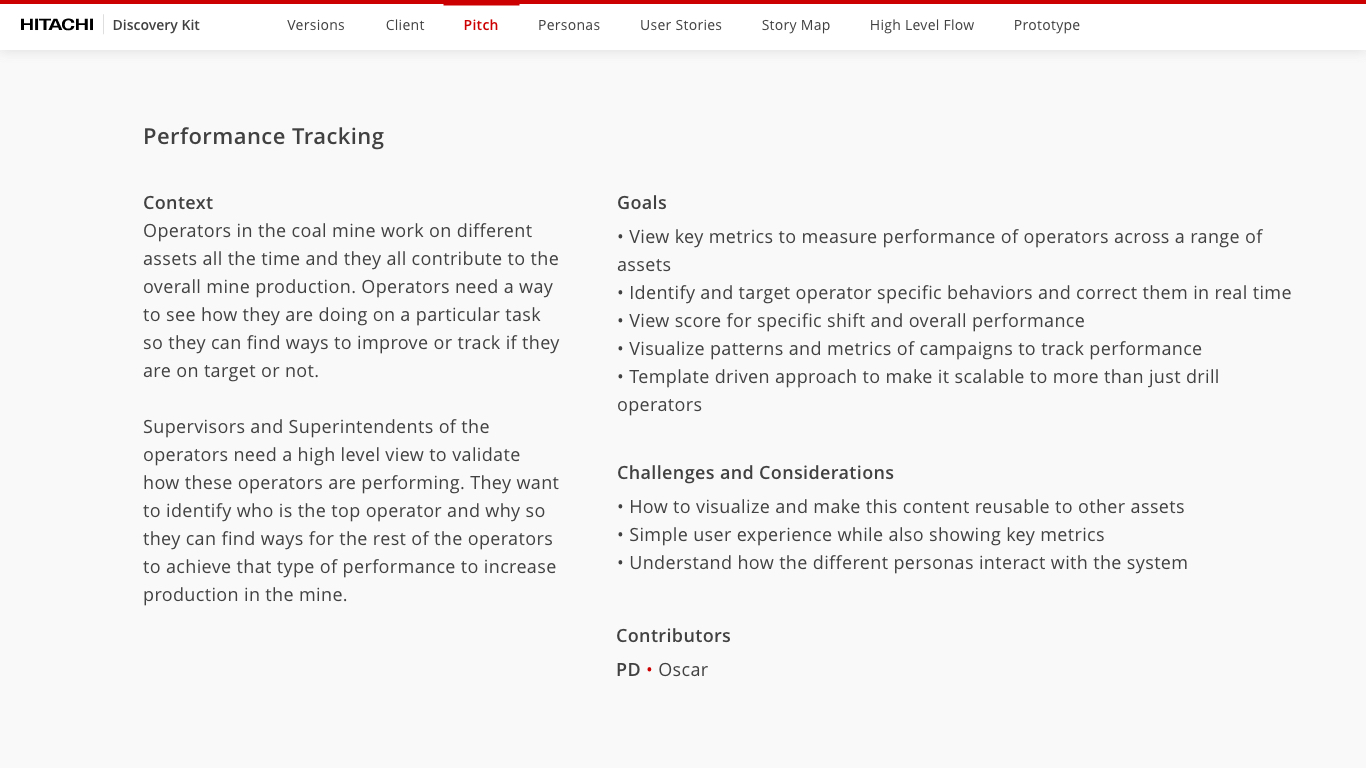
This initiative is part of a multi year customer engagement project with a mining company. Operators in the coal mine work on different assets all the time and they all contribute to the overall mine production. Supervisors of the operators need a high level view to validate how these operators are performing. They want to identify who is the top operator and why so they can find ways for other operators to increase production in the mine. This will also lead to lower costs on the assets they work on as well.
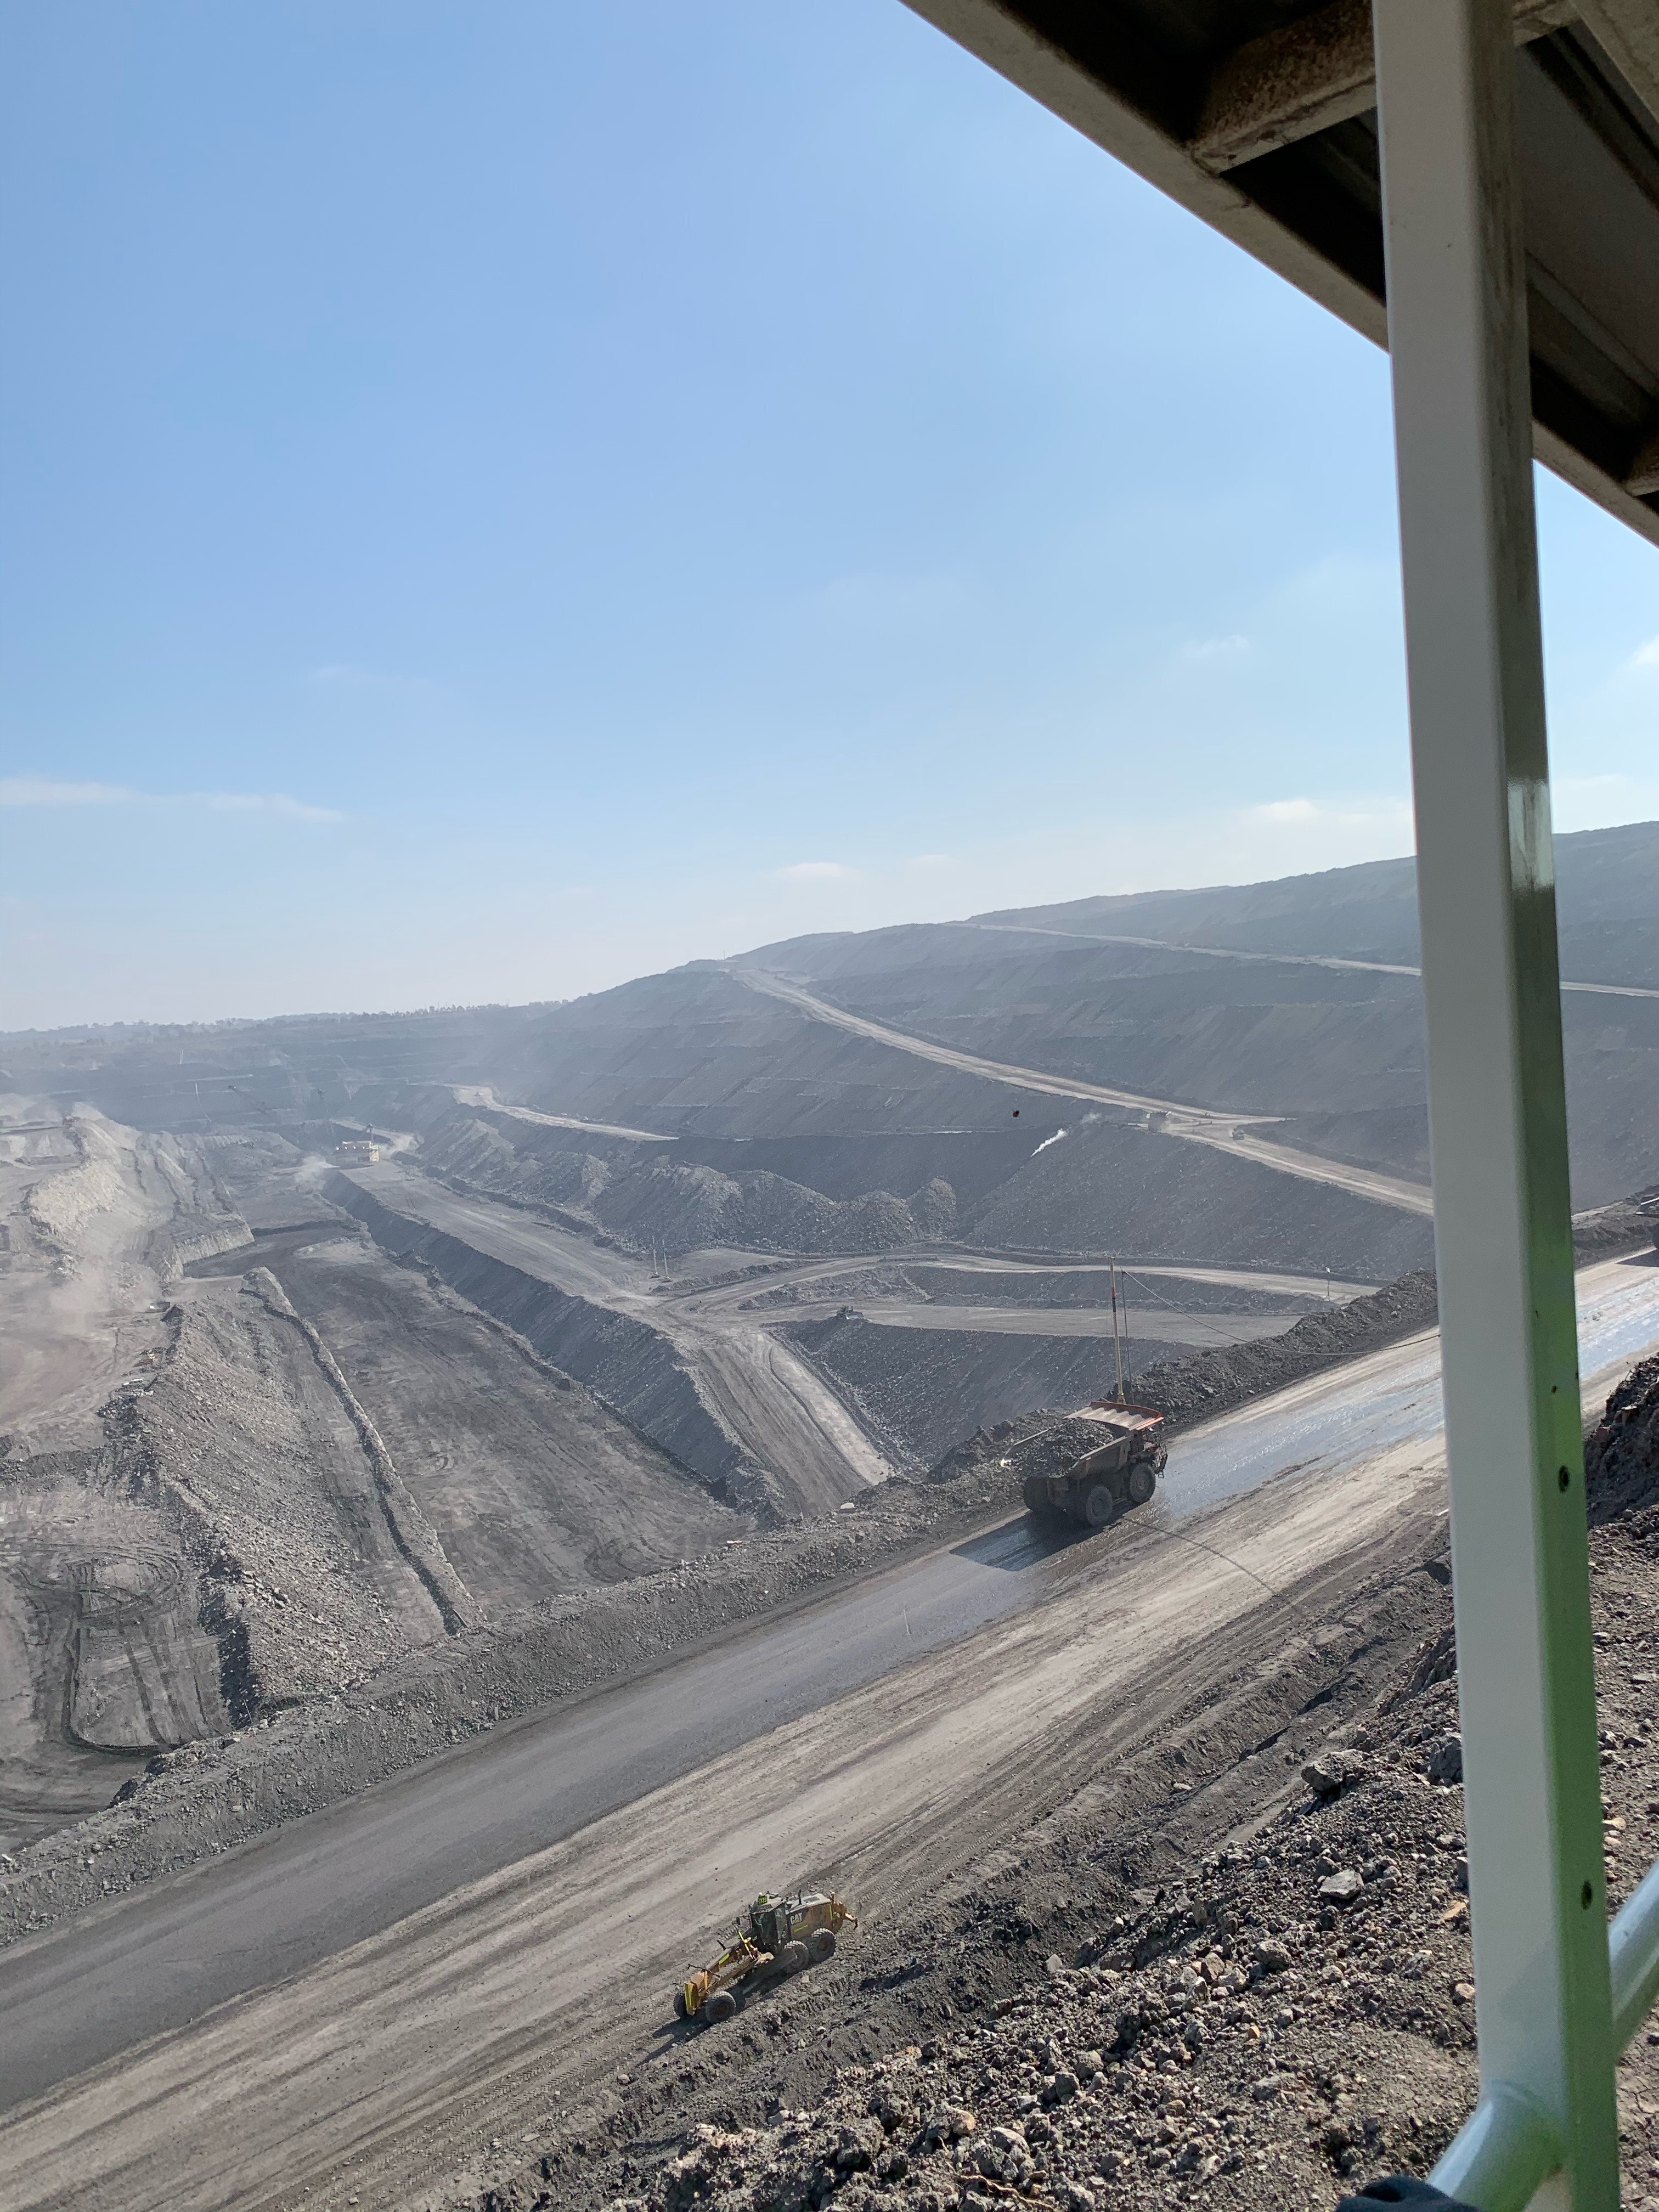
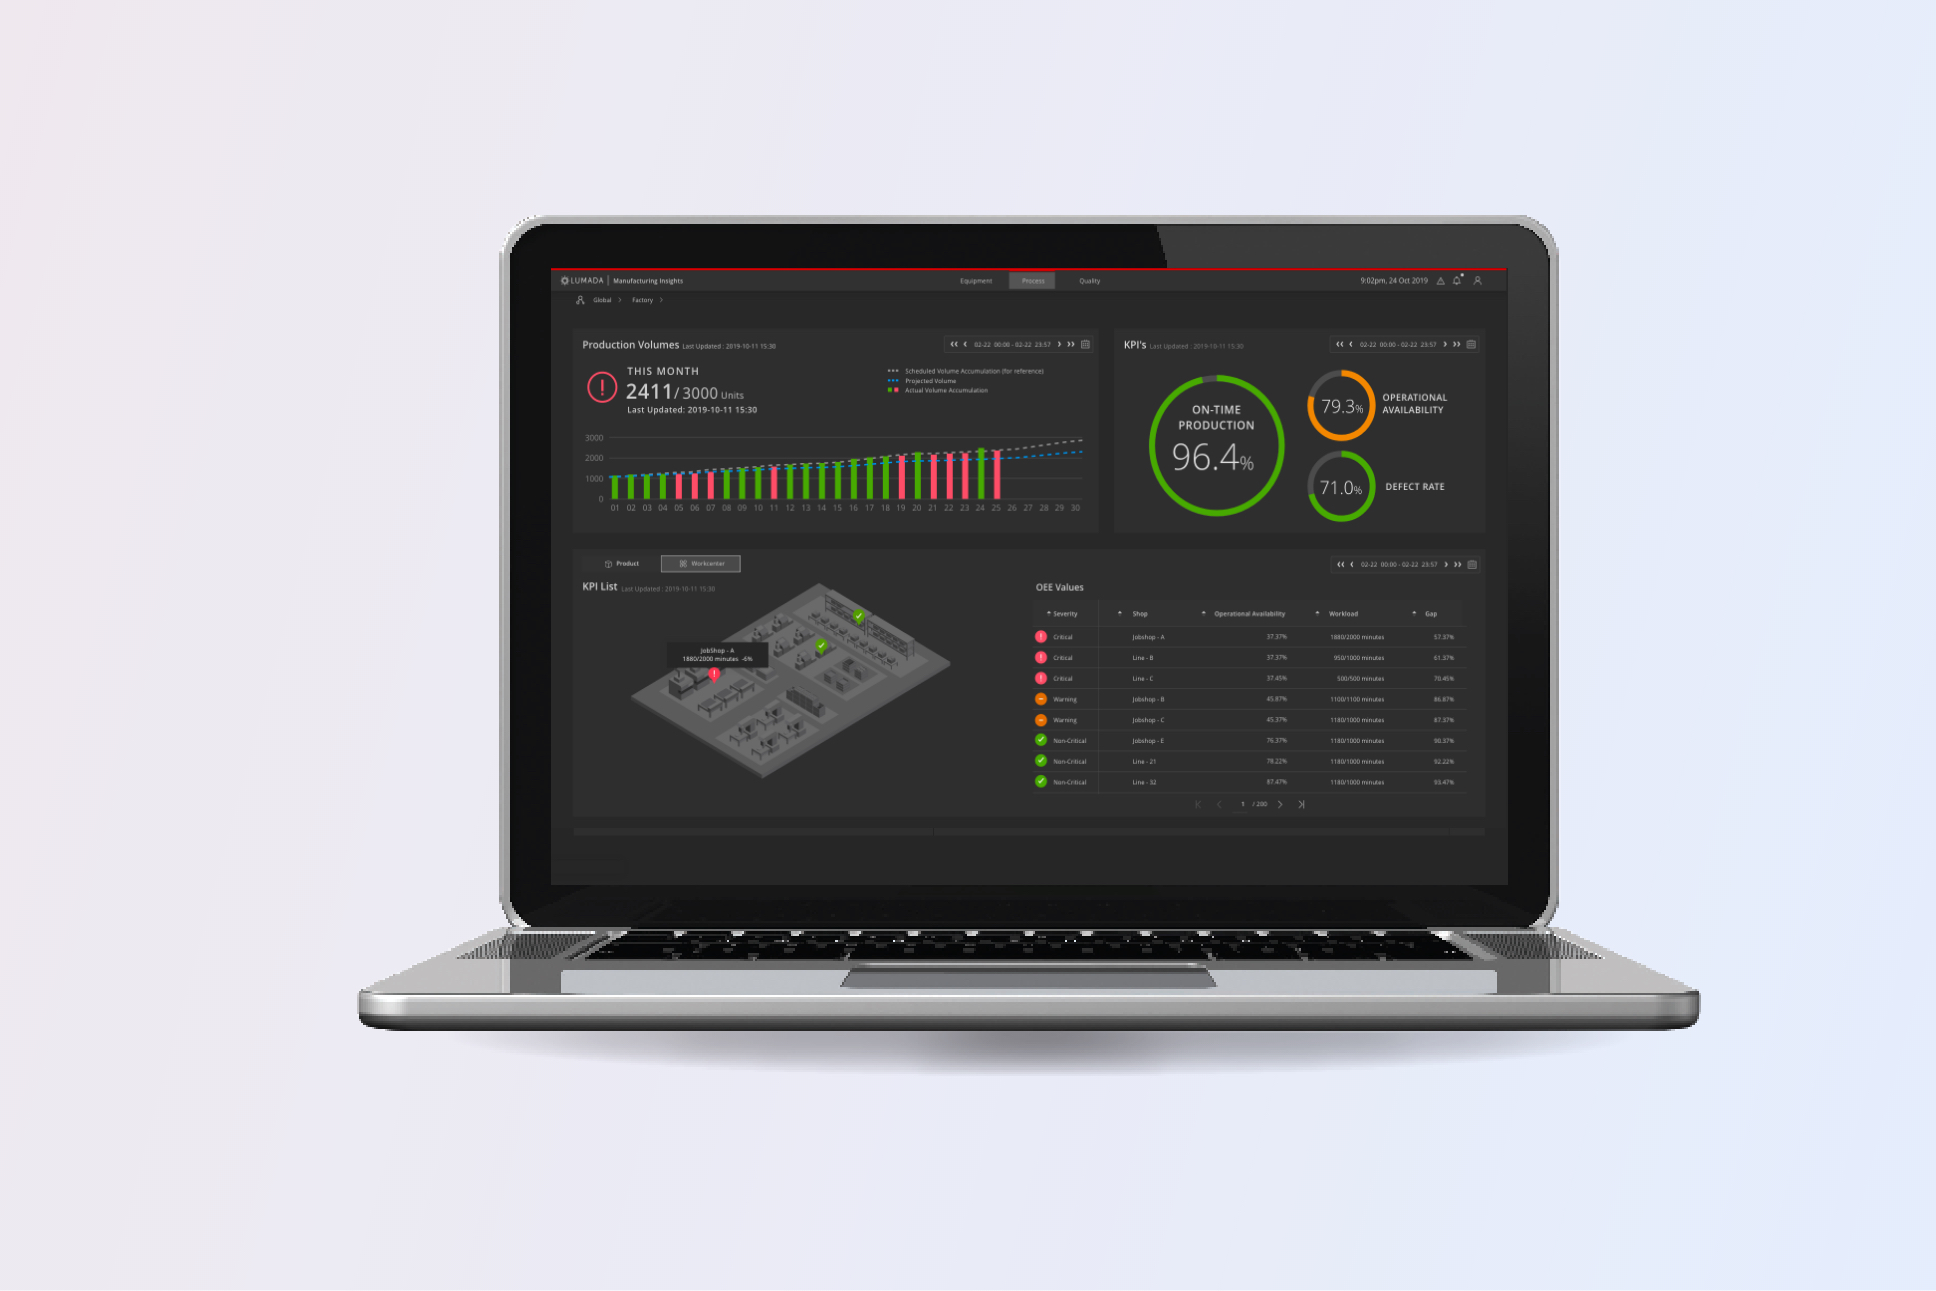
Mine fleet overview
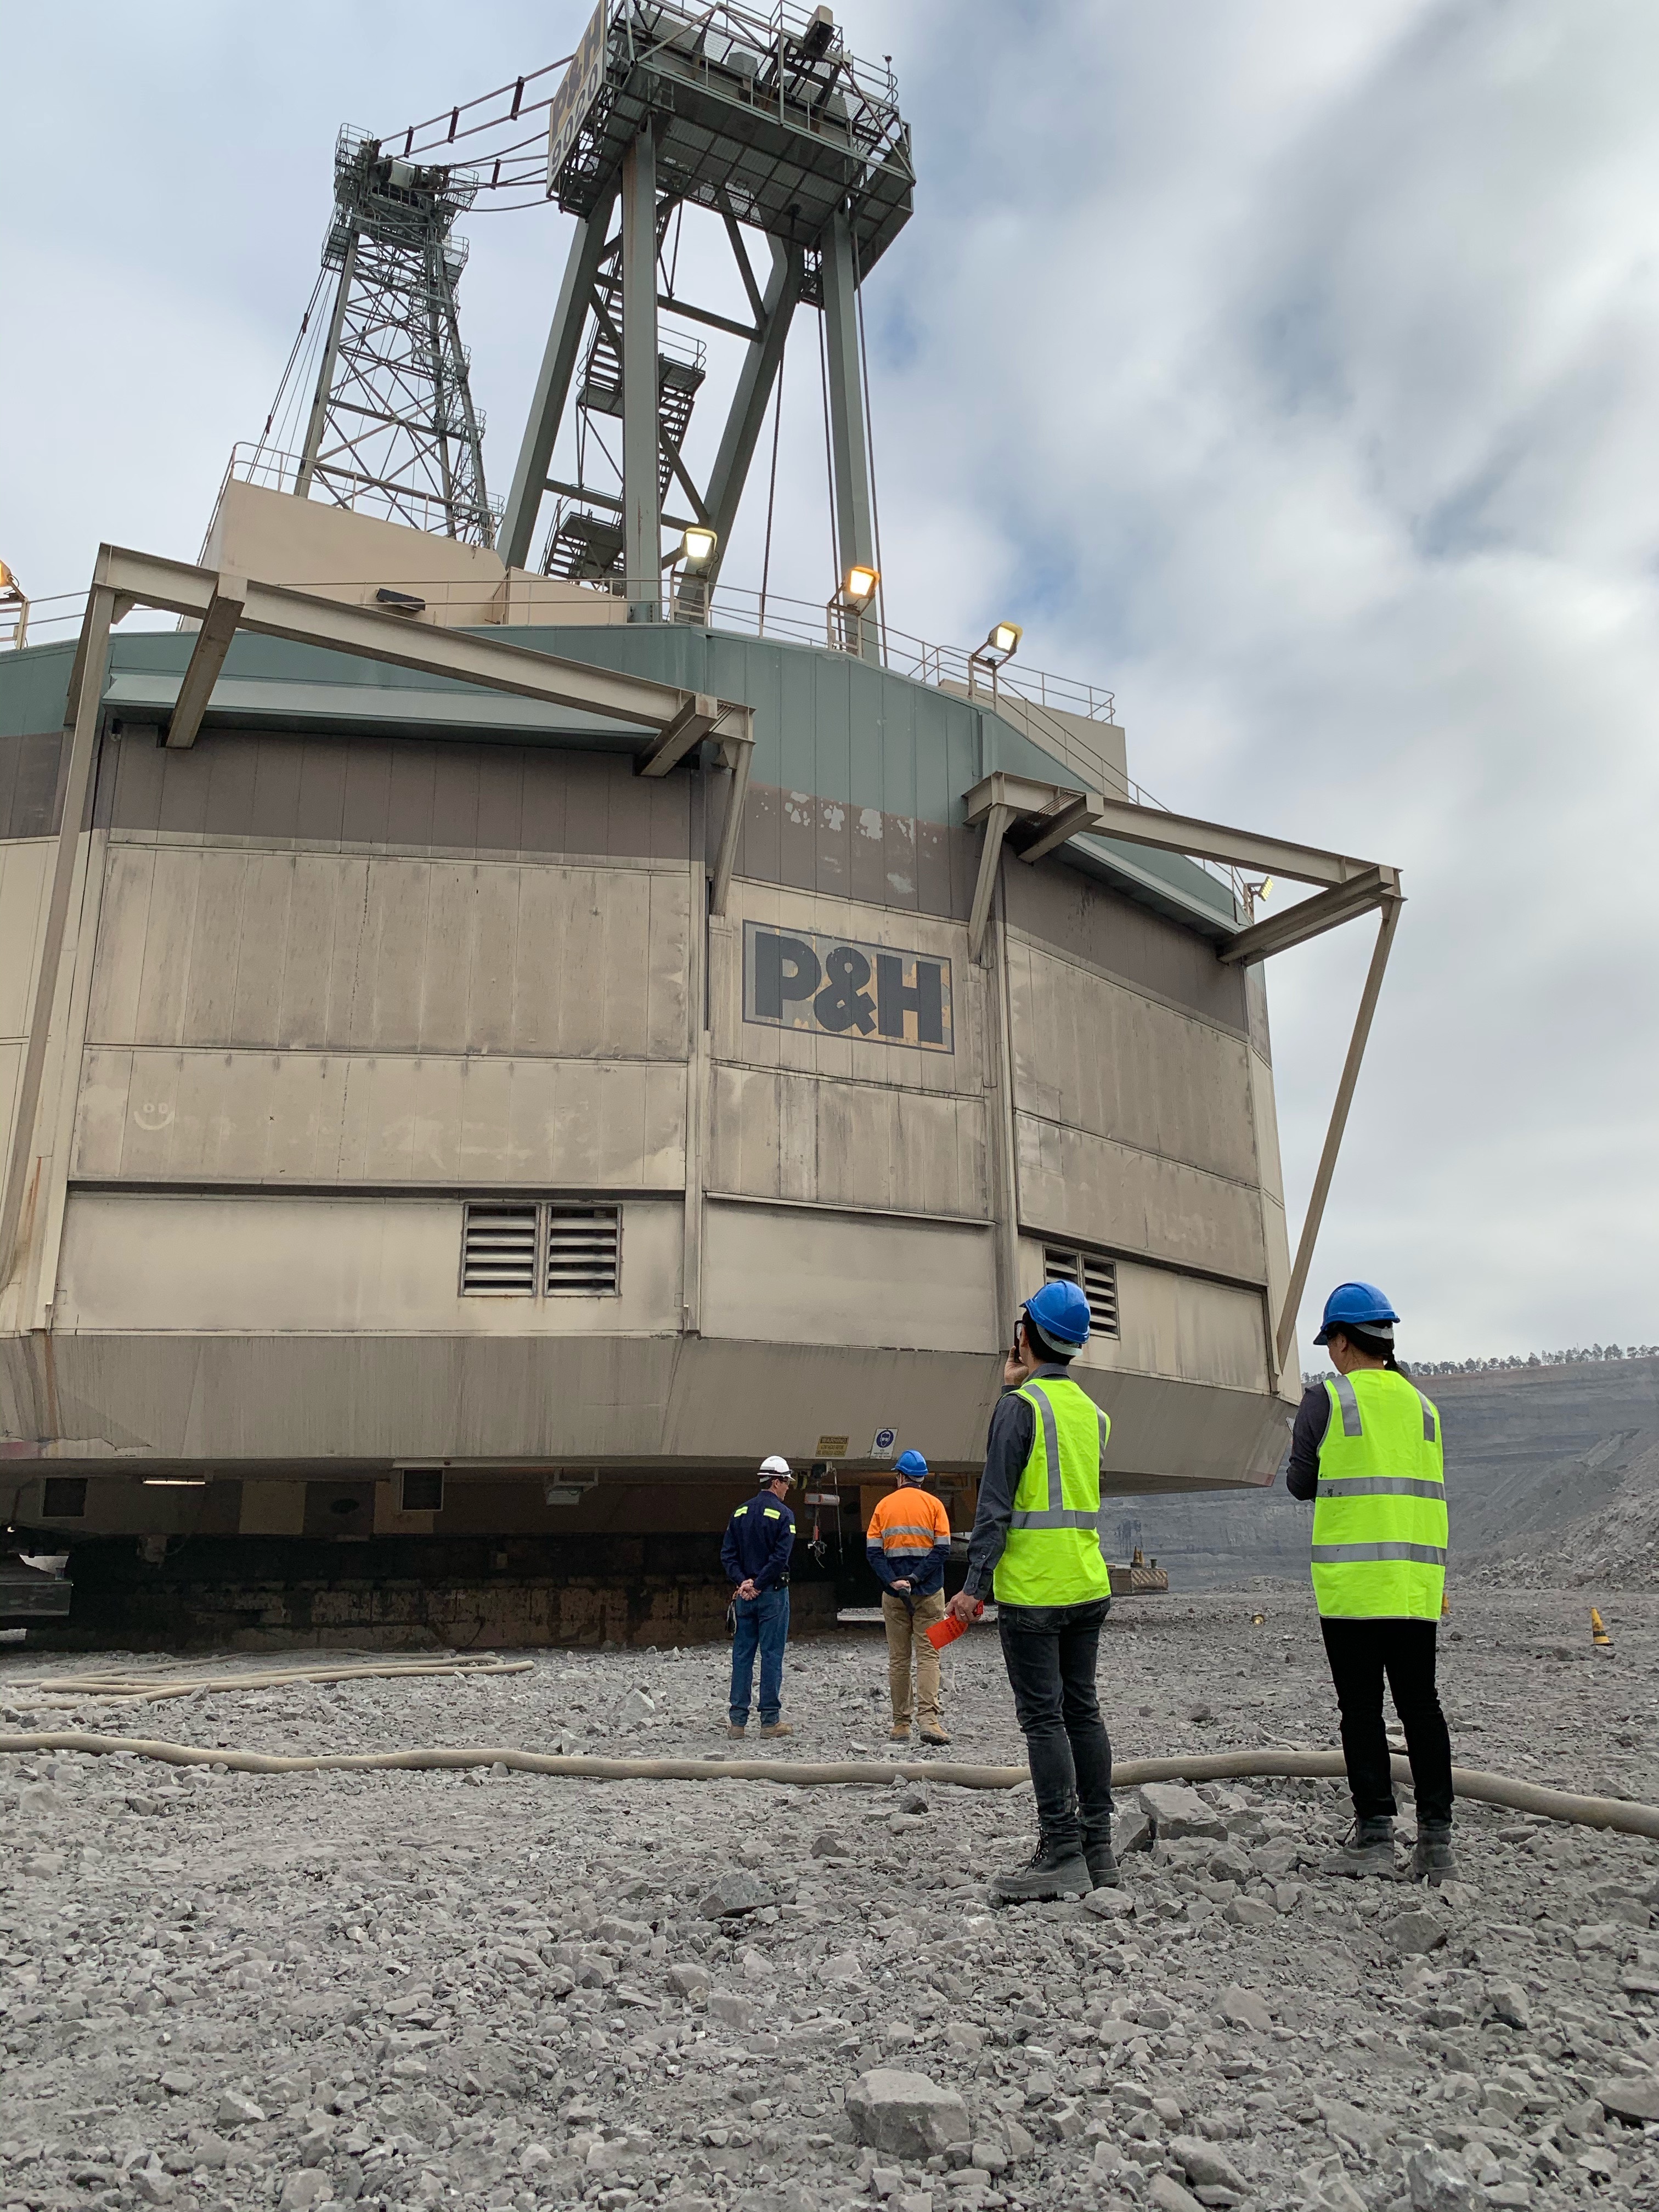
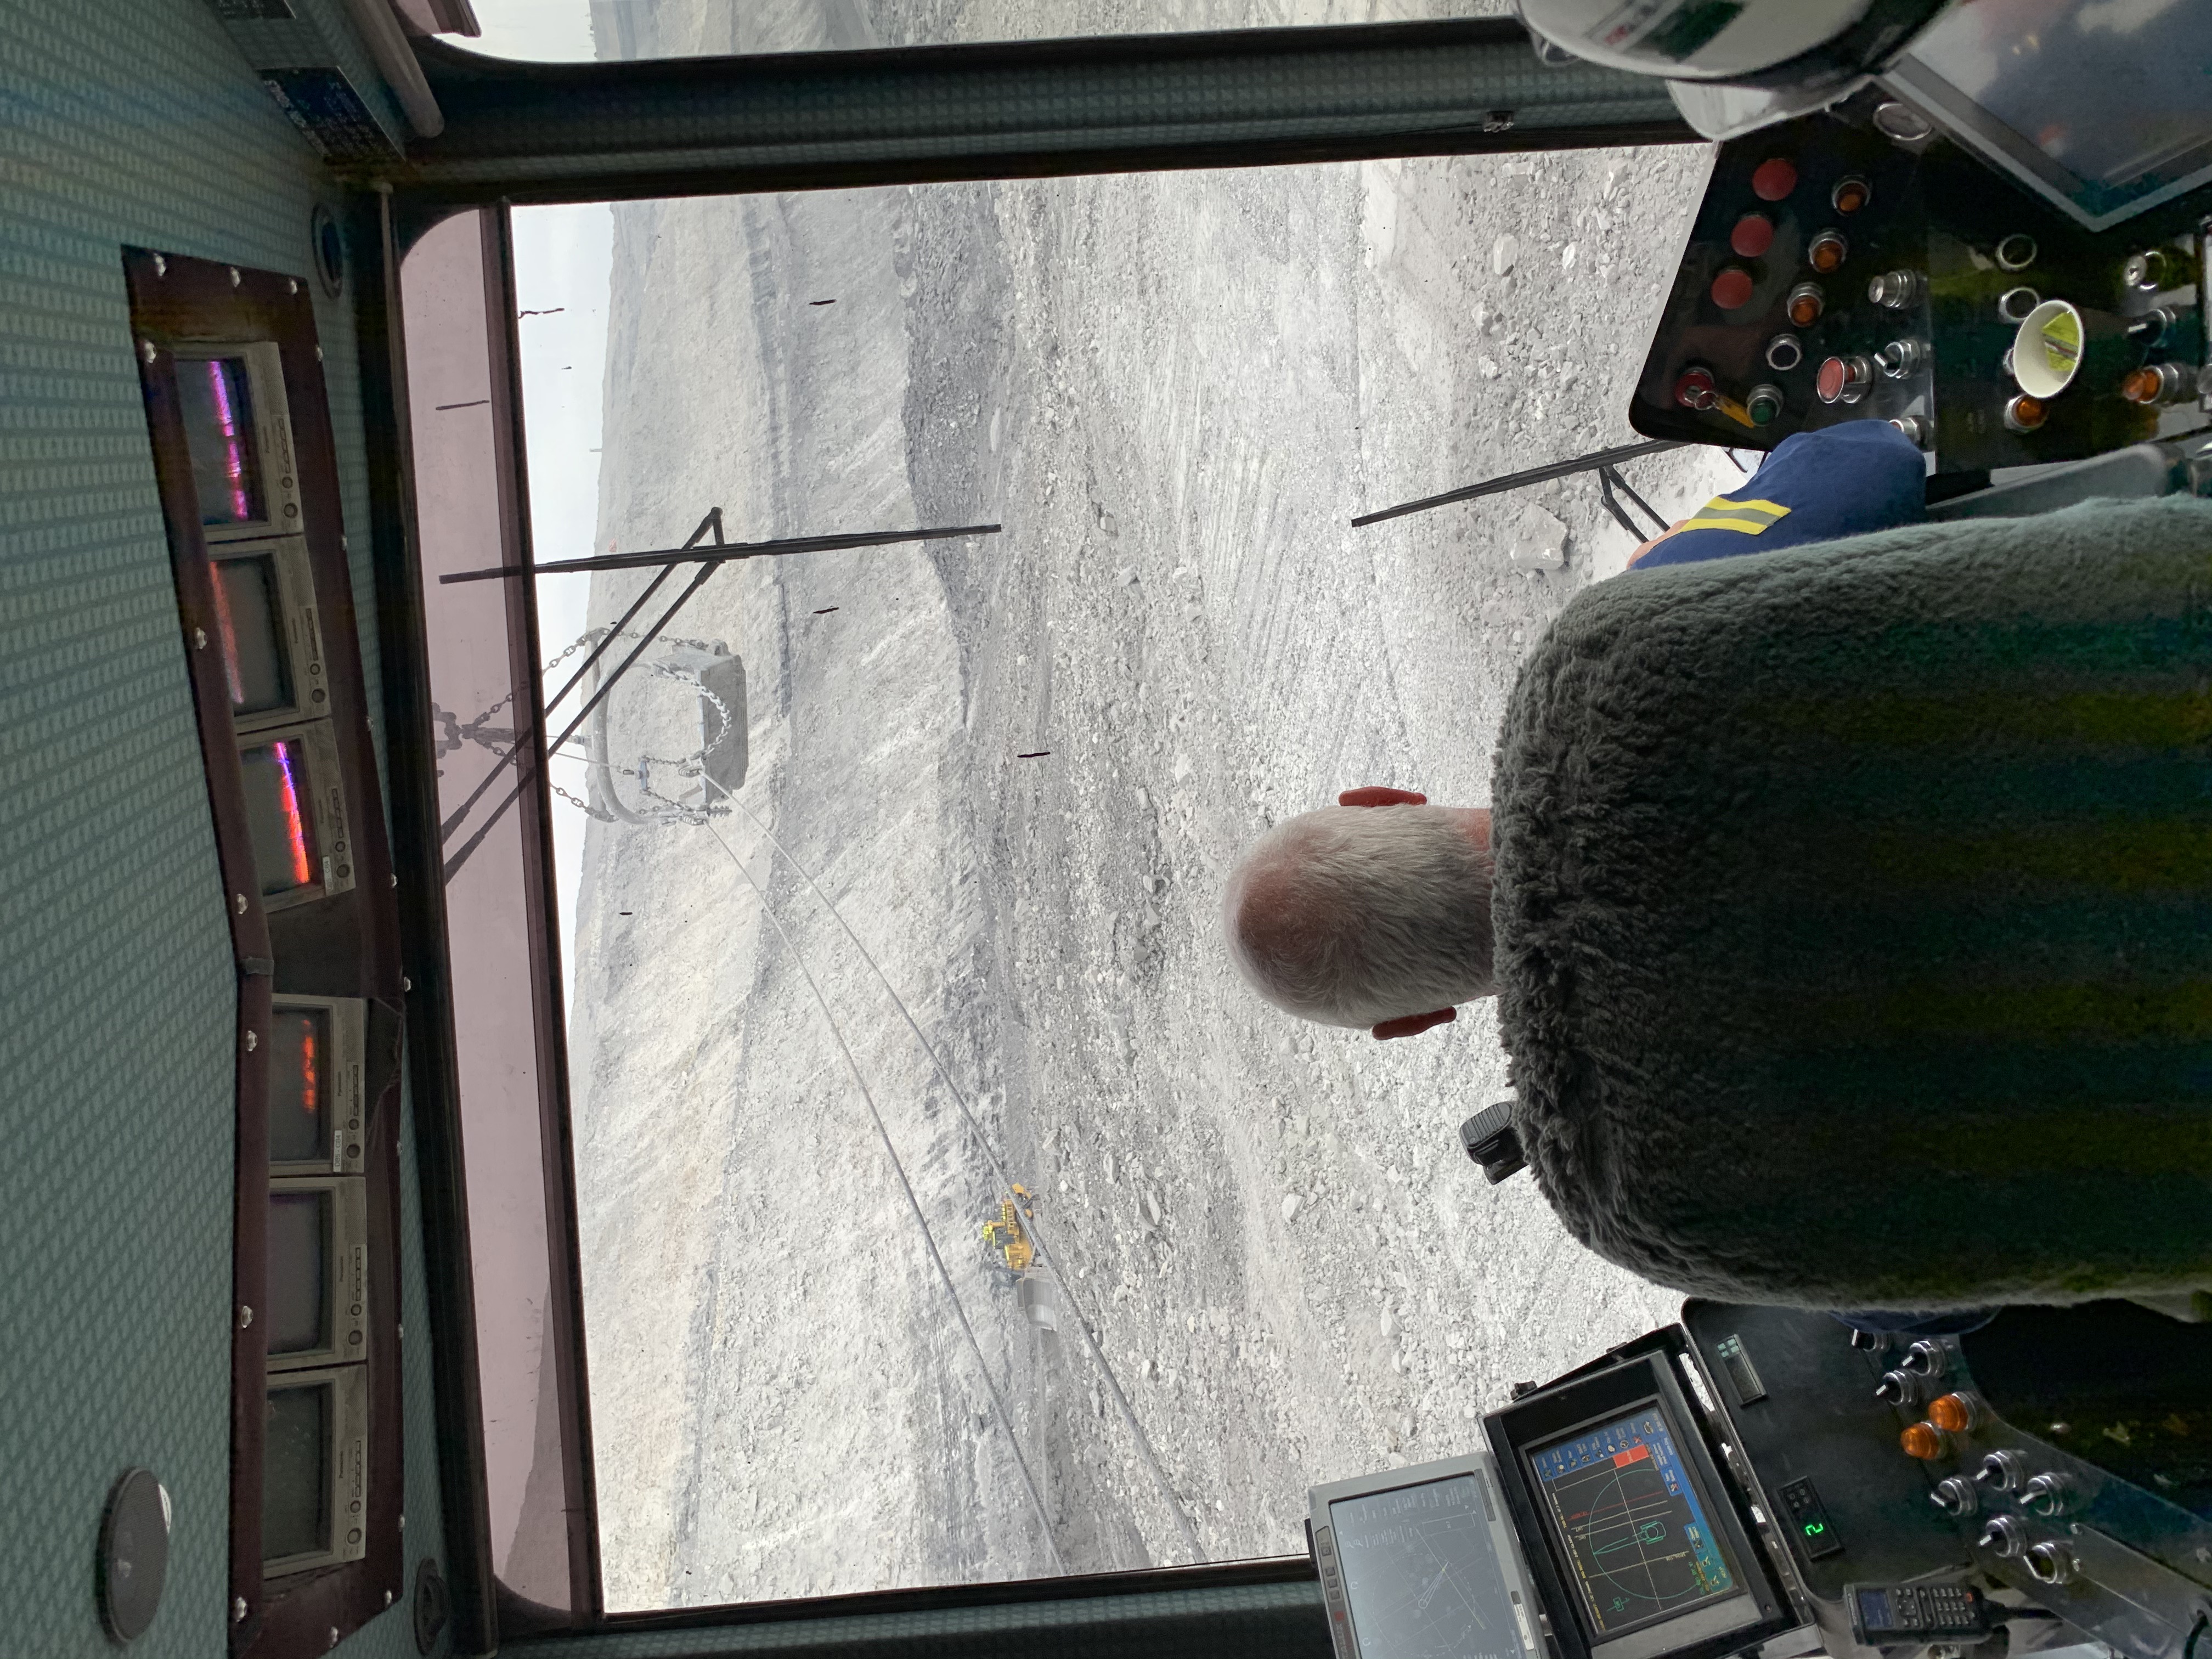
Dragline
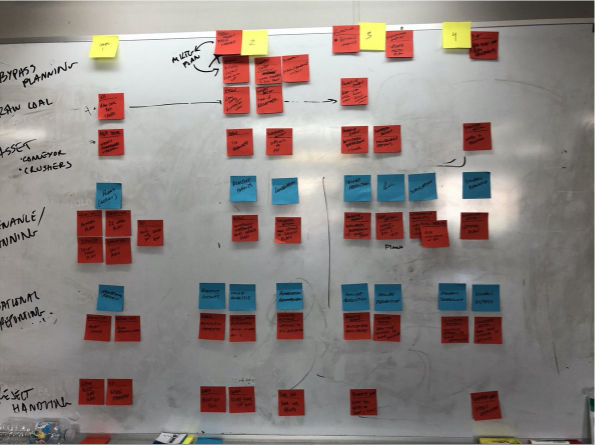
Discovery sessions to identify user needs
The project team leads went on a customer onsite workshop session to discover our client needs and requirements. Got a chance to do onsite interviews, explore and shadow some workers, and do field research. We went through multiple workshop sessions to discover what our client really needed which led to the operator optimization piece.
From the discovery, I created a pitch to align our goals
Worked with PMs to really understand the problem and what we are trying to achieve with the work here
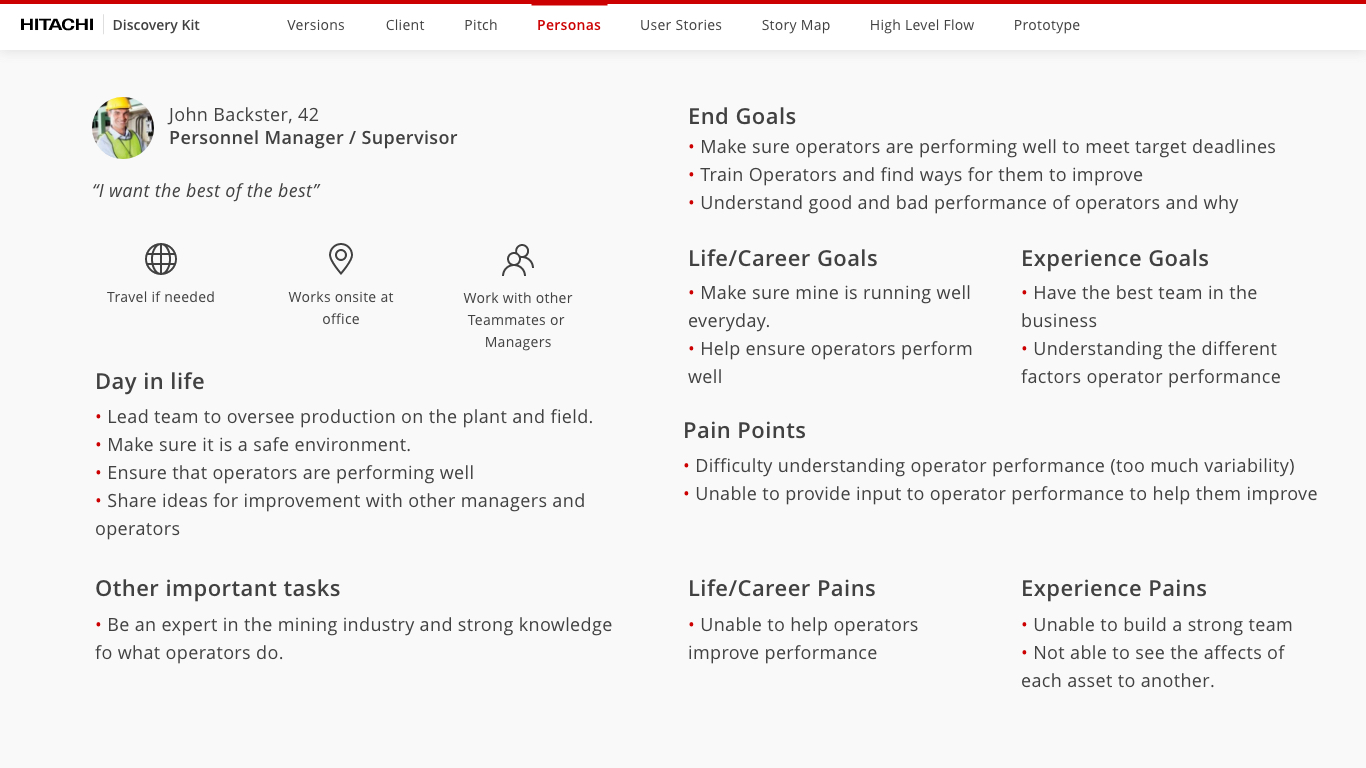
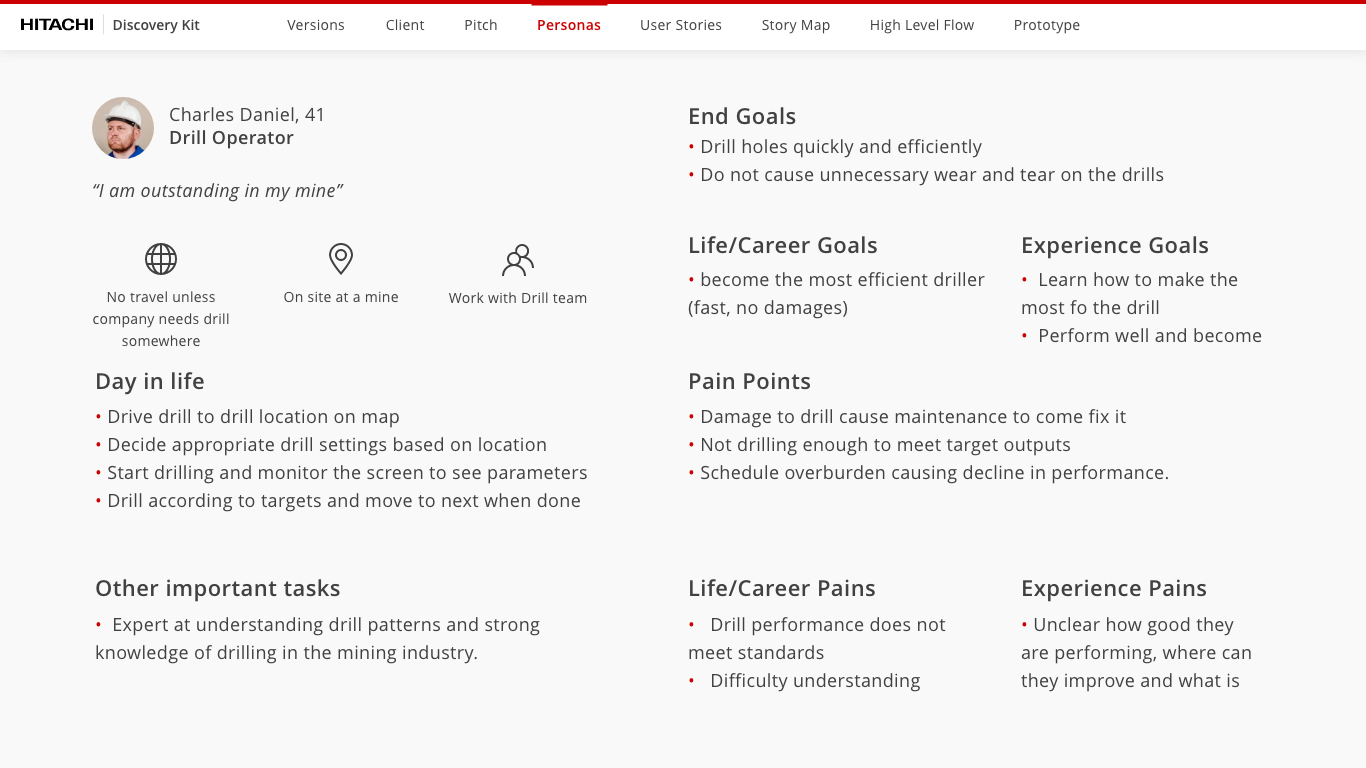
We then identified our main users and their needs
We identified the 2 main personas for this initiative and mapped out what their day in life was like, goals, and pain points to really understand our user. We then highlighted the main user needs that we discovered.
Personnel Manager
Drill Operator
Evaluate operator performance, what is good and bad
See a score and additional supporting insights
Ability to evaluate a single shift and over a period of time
See any patterns and how operator compares to others
See own performance each shift
View KPI's and insights
View trends over time
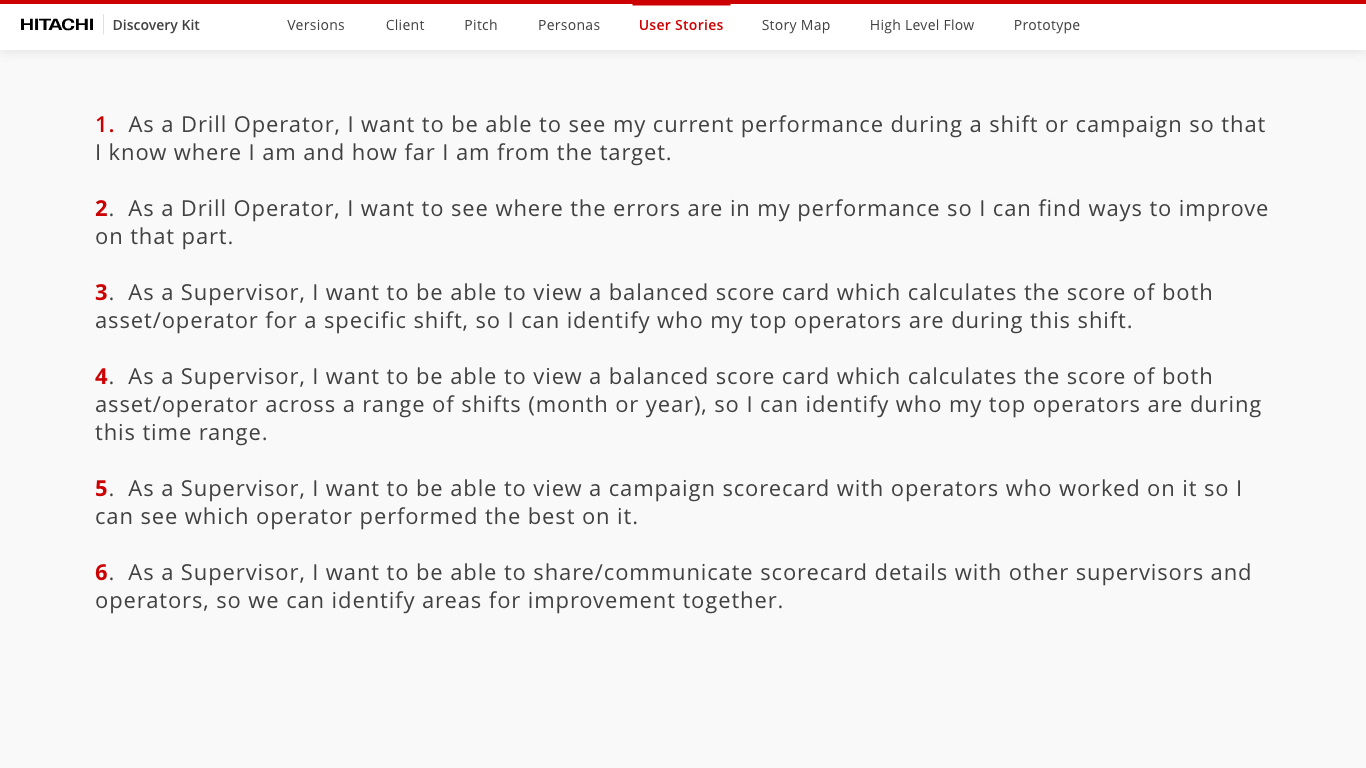
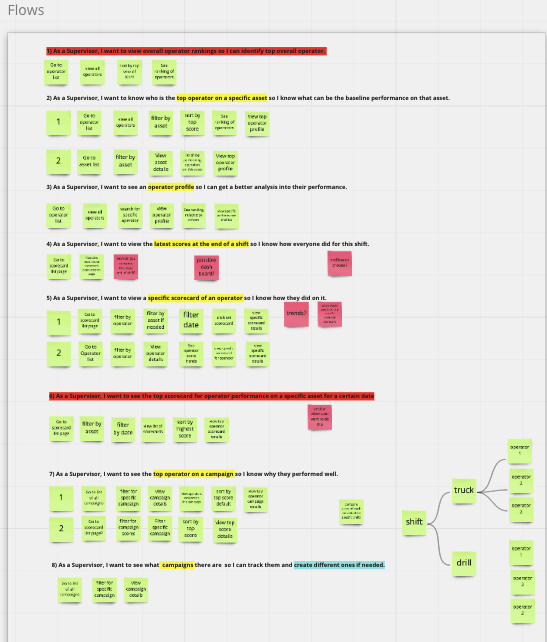
Created user stories and mapped out the user flow for each
After analyzing the results from the interviews and other discovery material I created user stories to map out the user needs and their actions. I then flowed out the main stories so we can see what the journey is like.
High level flow to draw connections
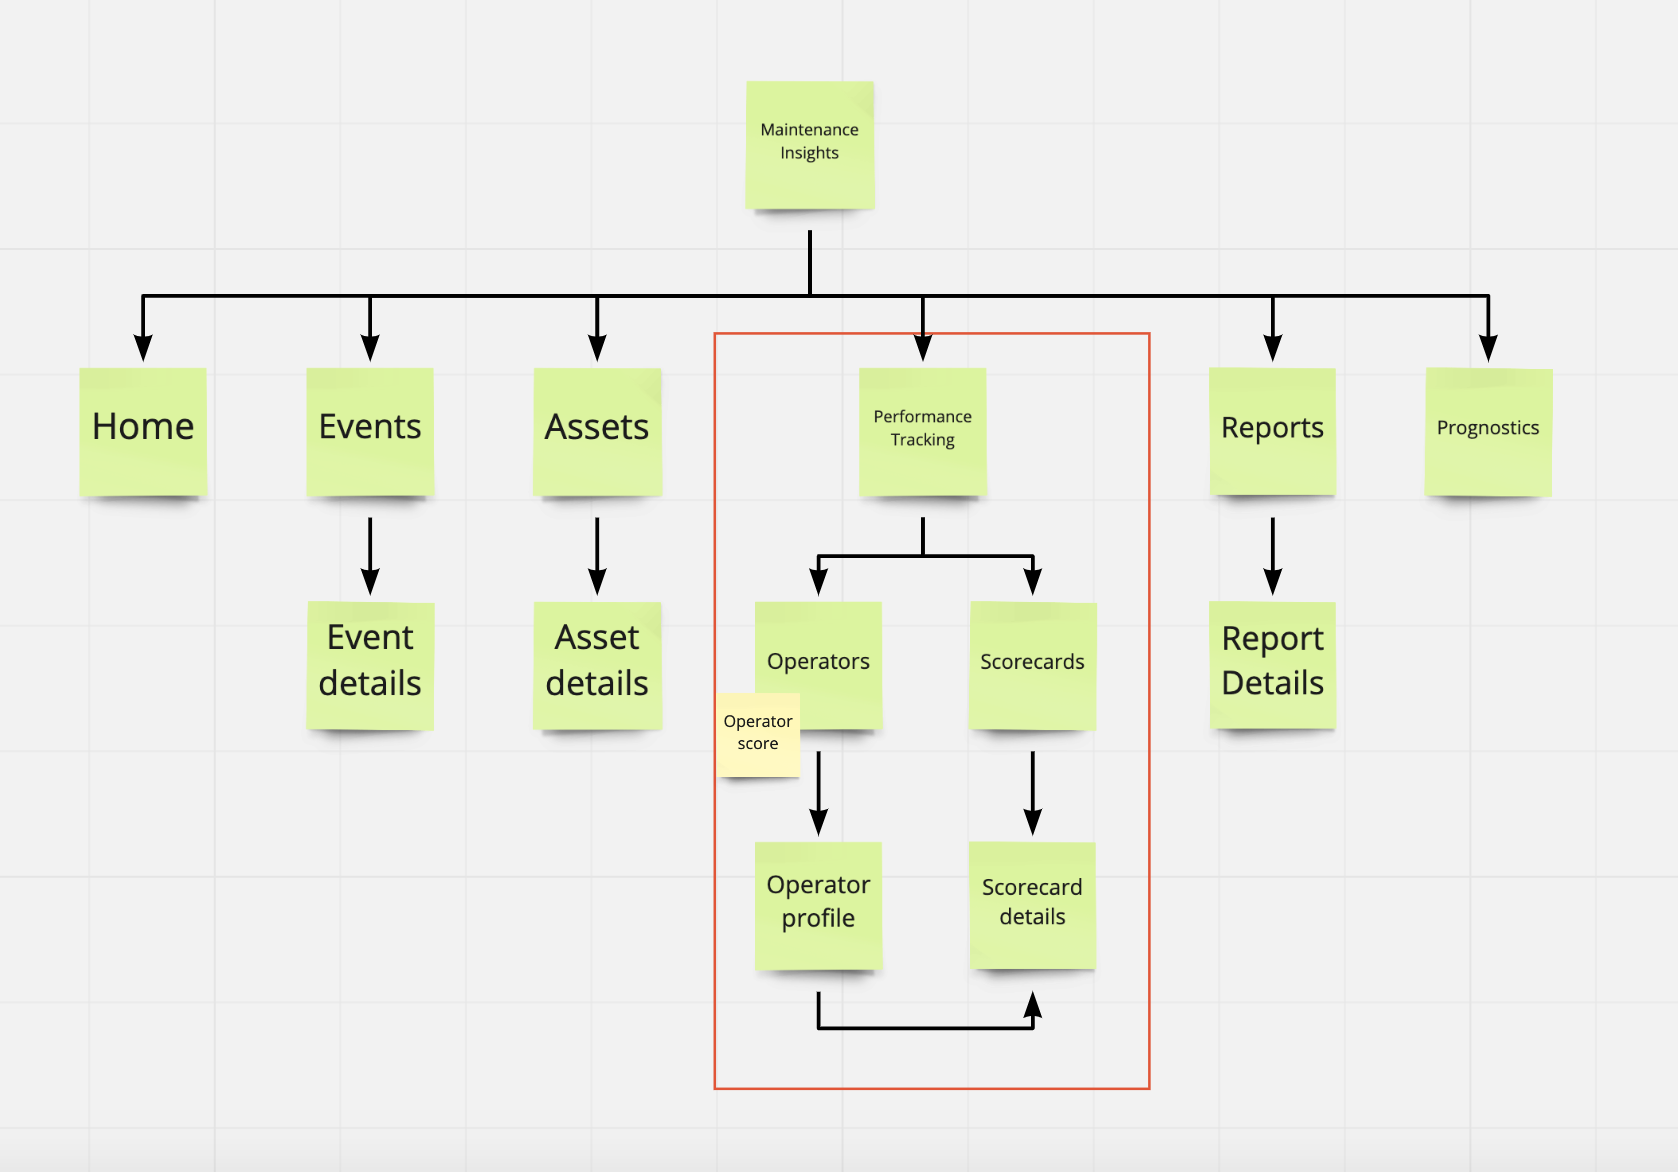
Next I mapped out how the operator optimization piece will fit into the innformation architecture with the rest of the application.
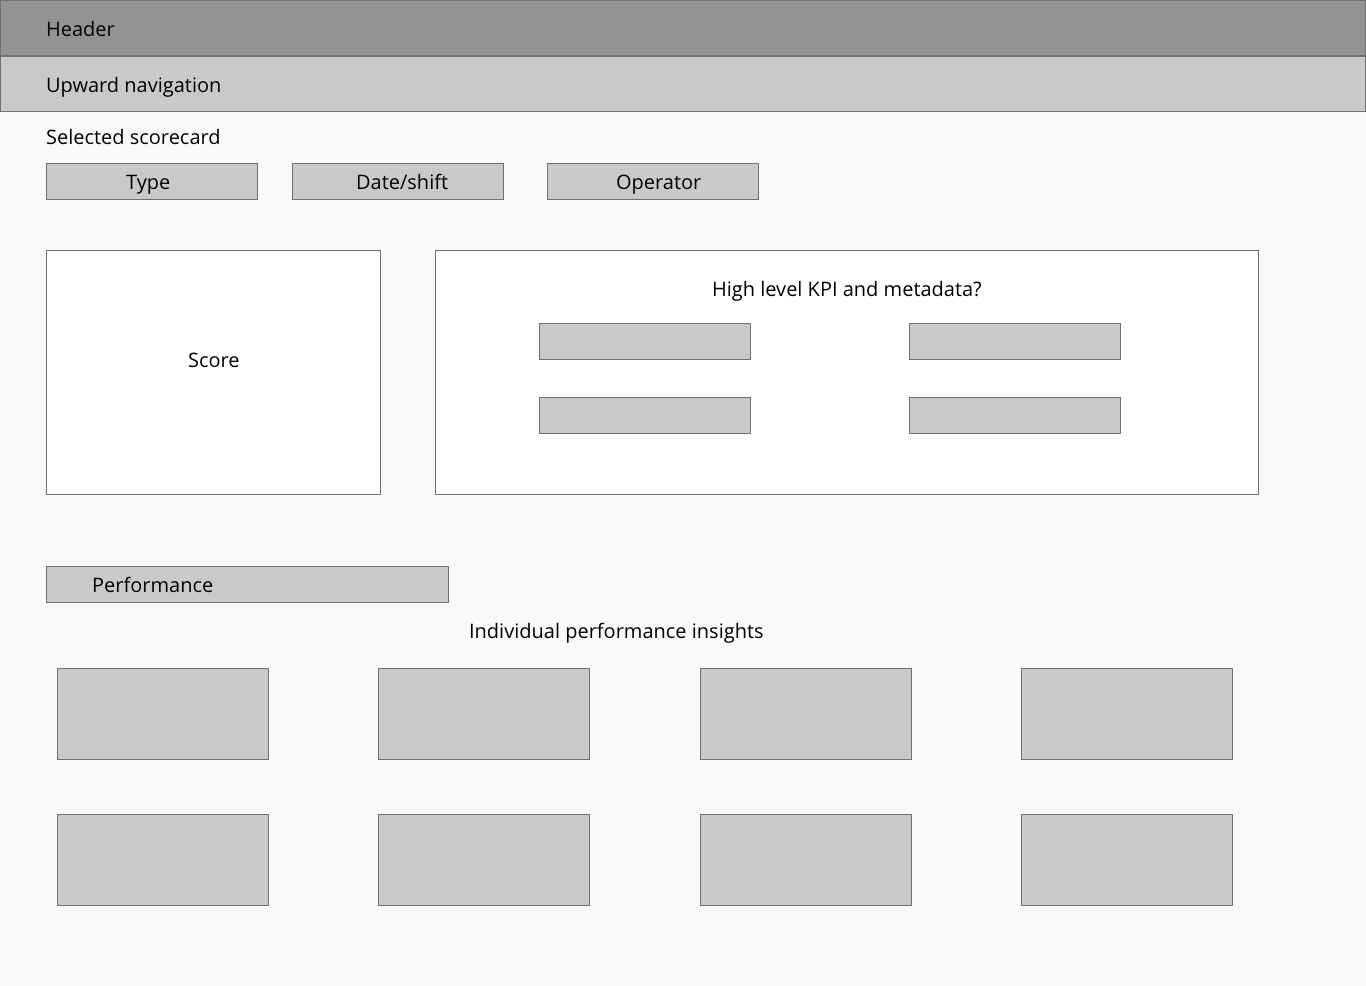
Next I created initial sketch and designs of the scorecard
I started with initial sketches and continued to iterate with other stakeholders and did feedback sessions with our users to get their thoughts. Then I dived into more detailed mockups after getting their feedback.
Got feedback from stakeholders and users
Had feedback sessions with our users and stakeholders to get their input. This feedback helps shape the design changes and areas we need to focus on.
Focus on core statistics to show, deep dive
Need view of all scorecards for a shift
Understand how operators compare with others
Need to change date for a scorecard
Differentiate between generic details vs actual stats
Just KPI's are not enough, need to show trends
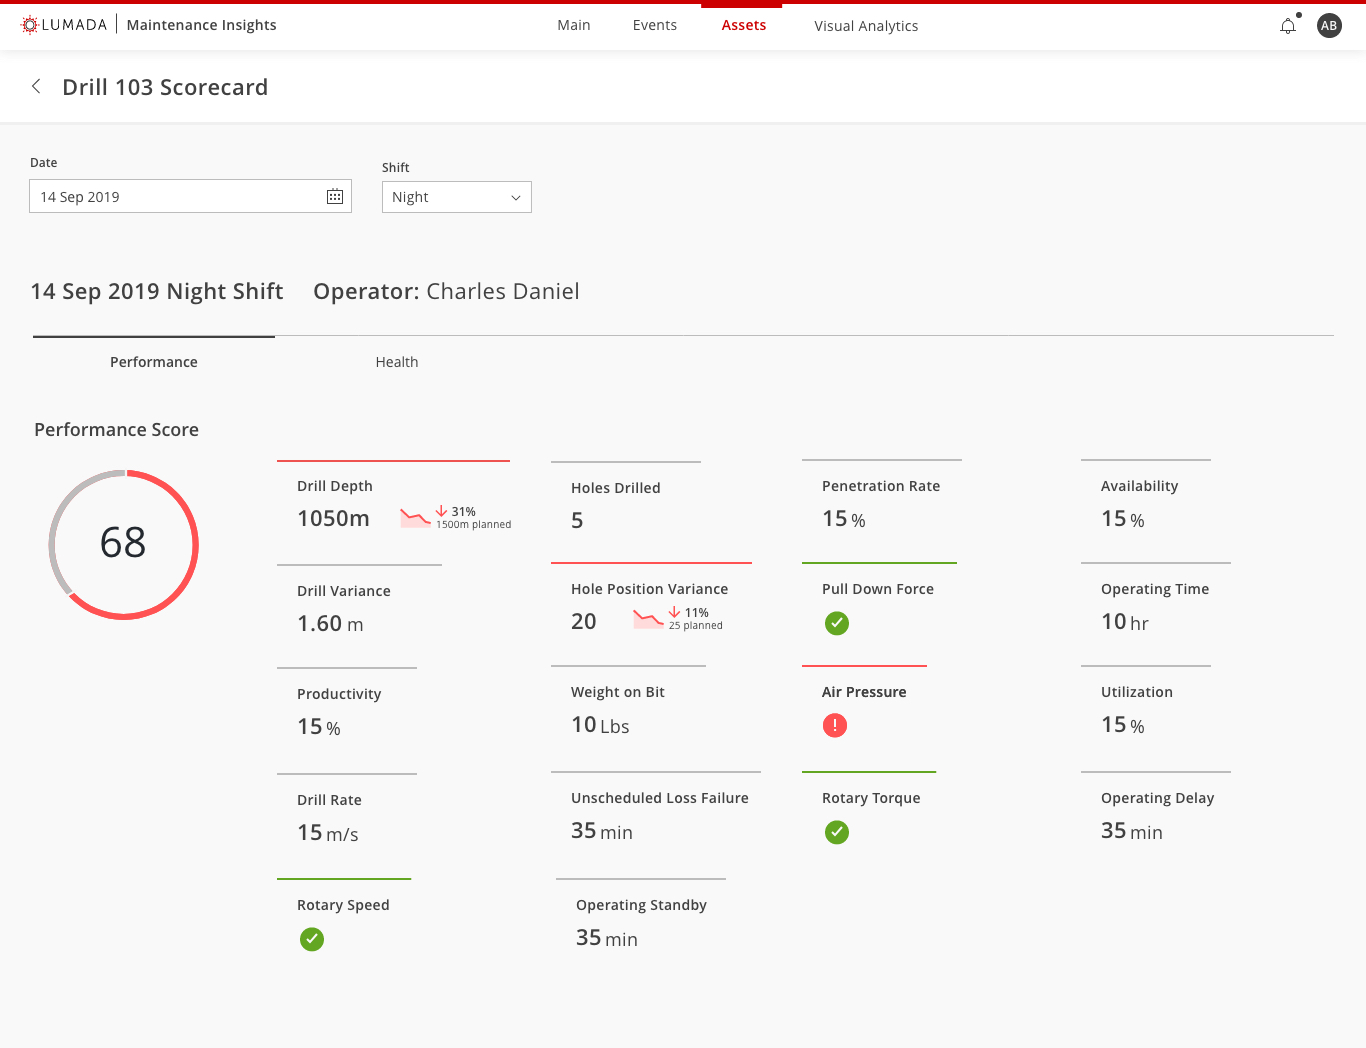
Final design after incorportating feedback
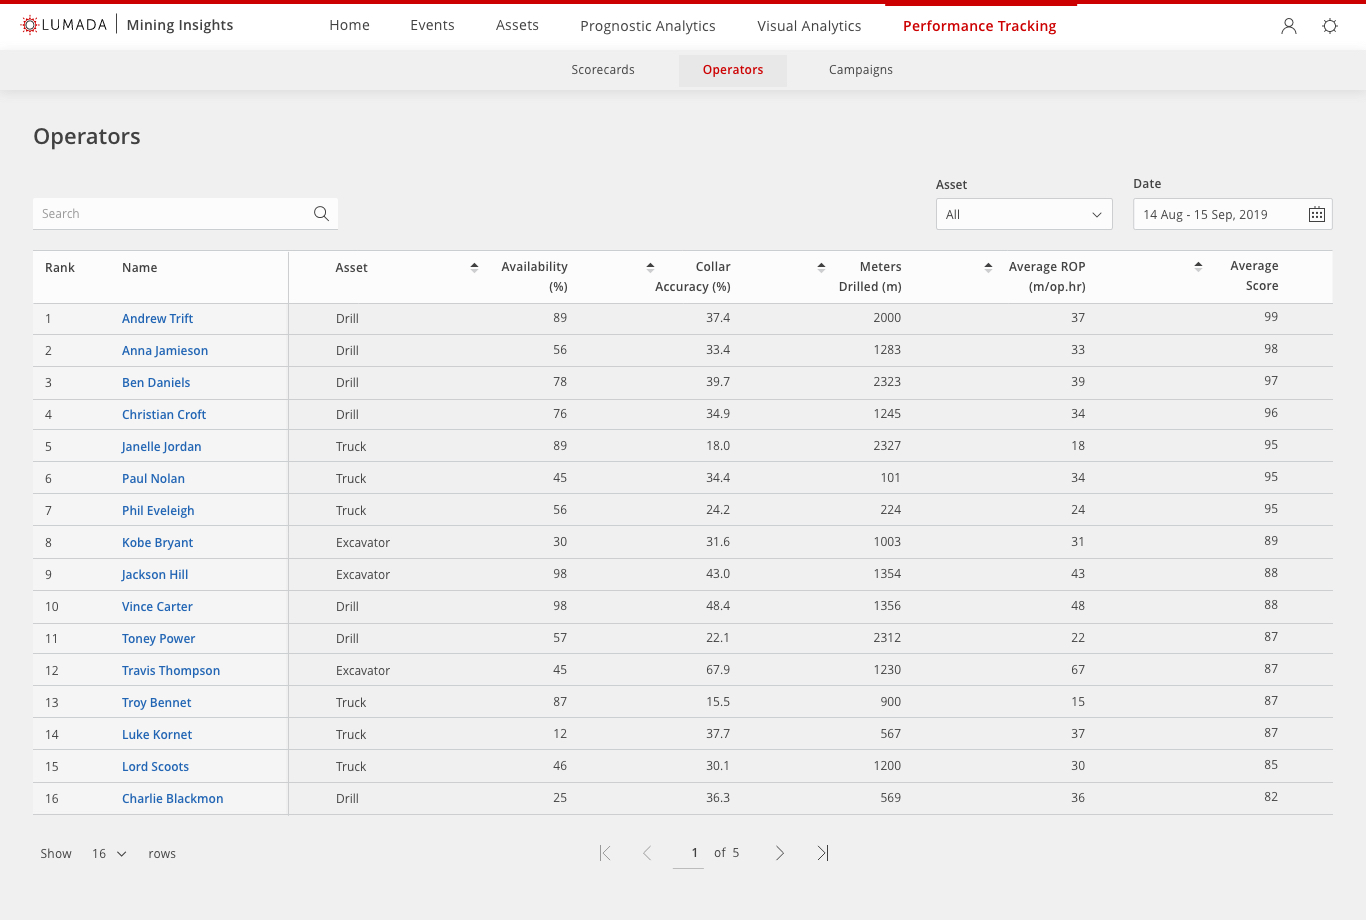
List of operators
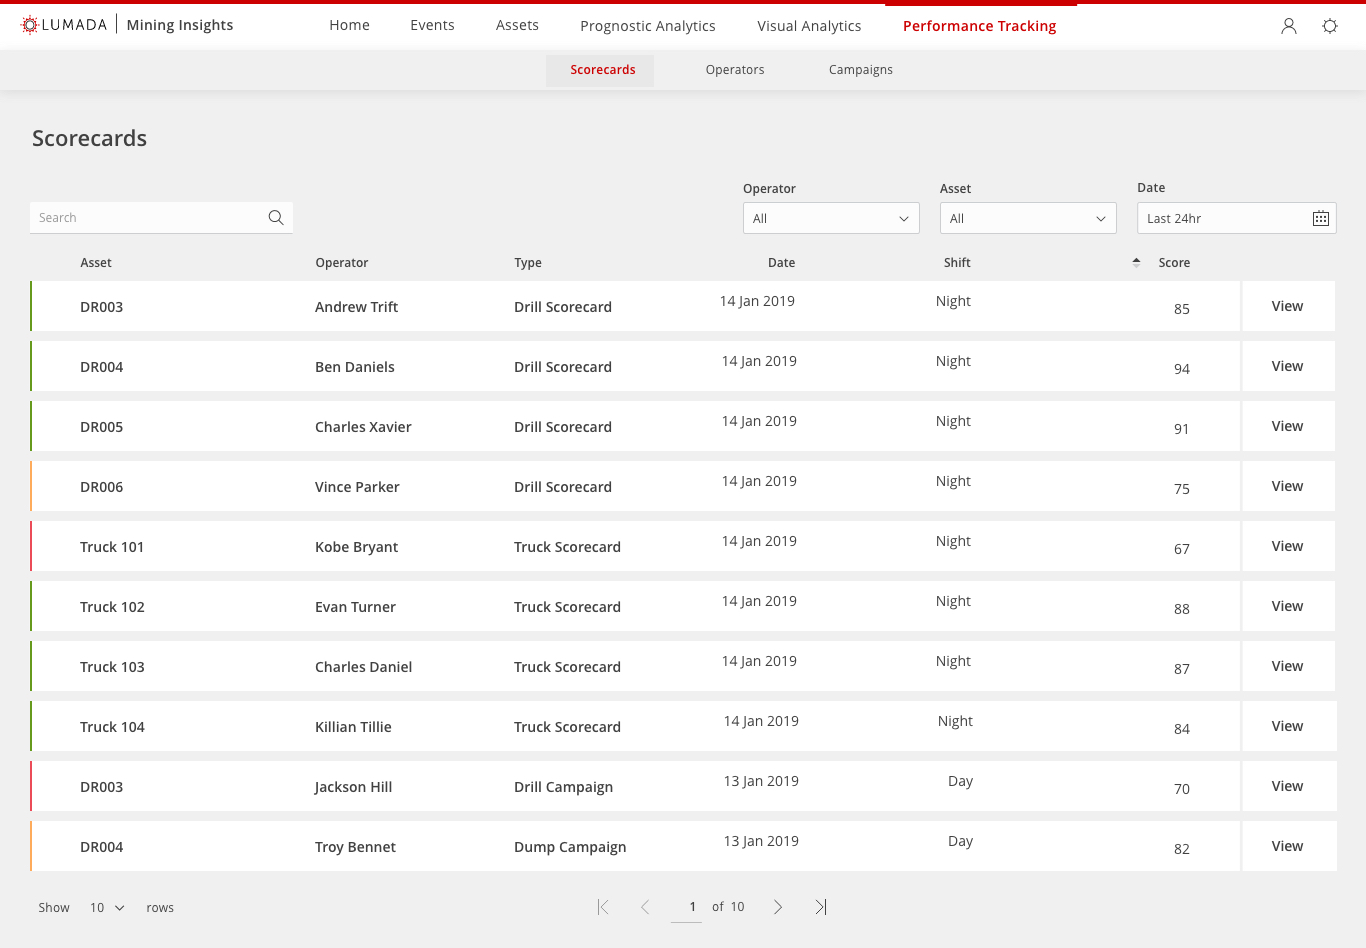
List of scorecaards
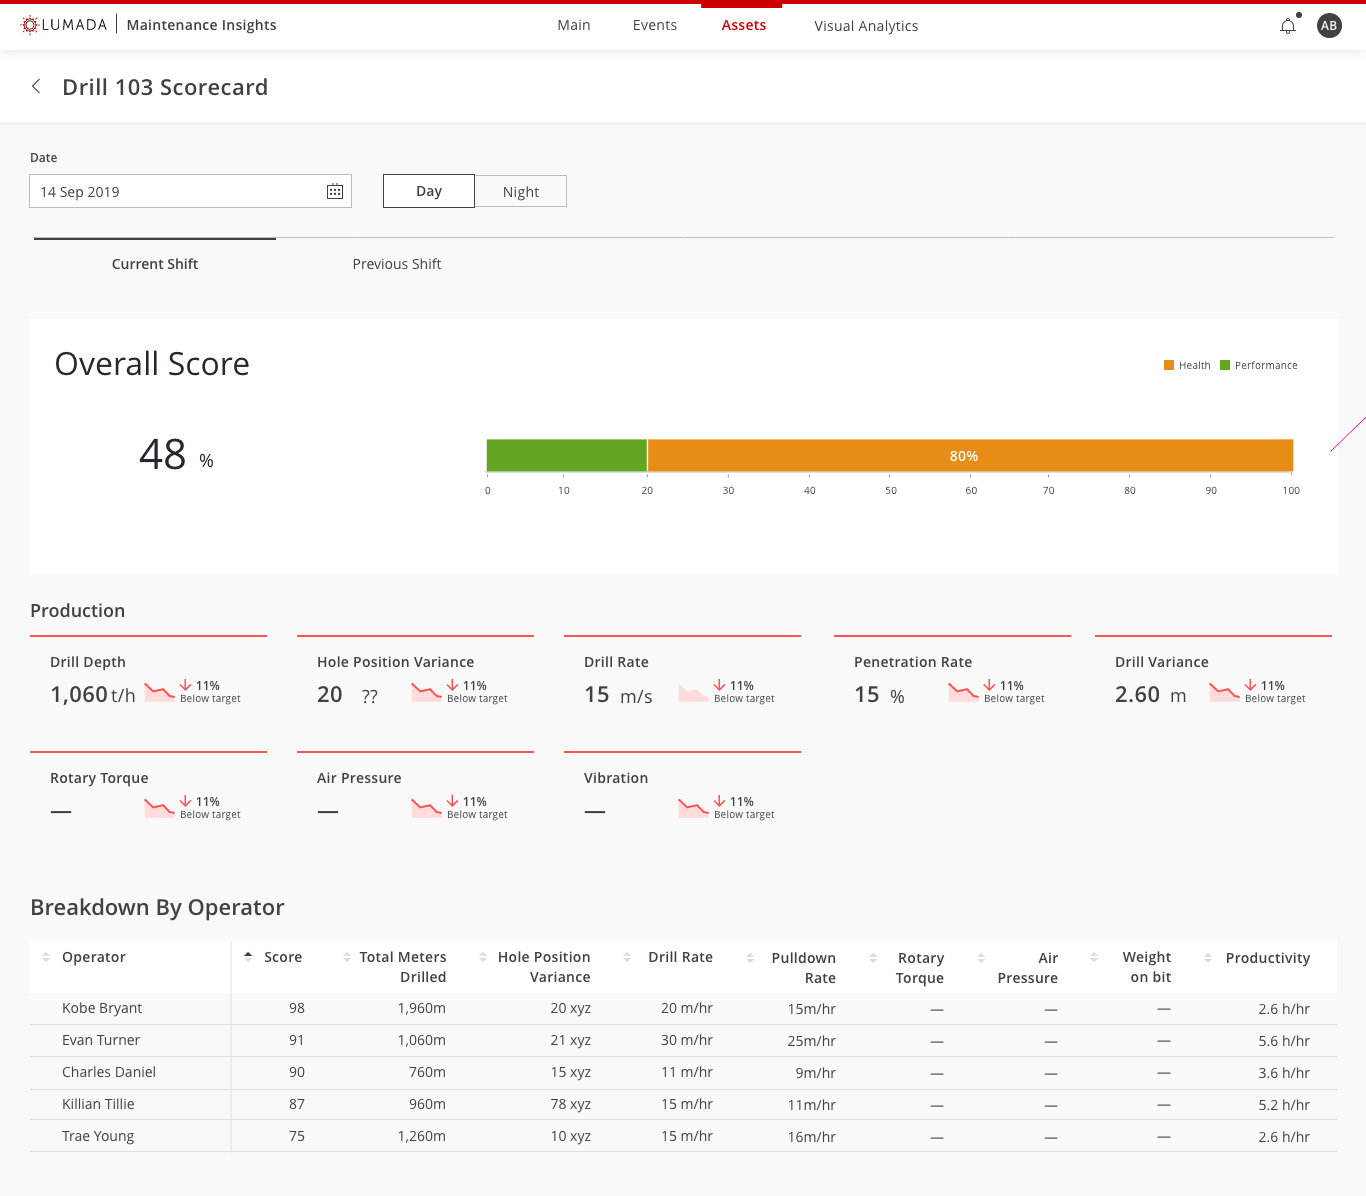
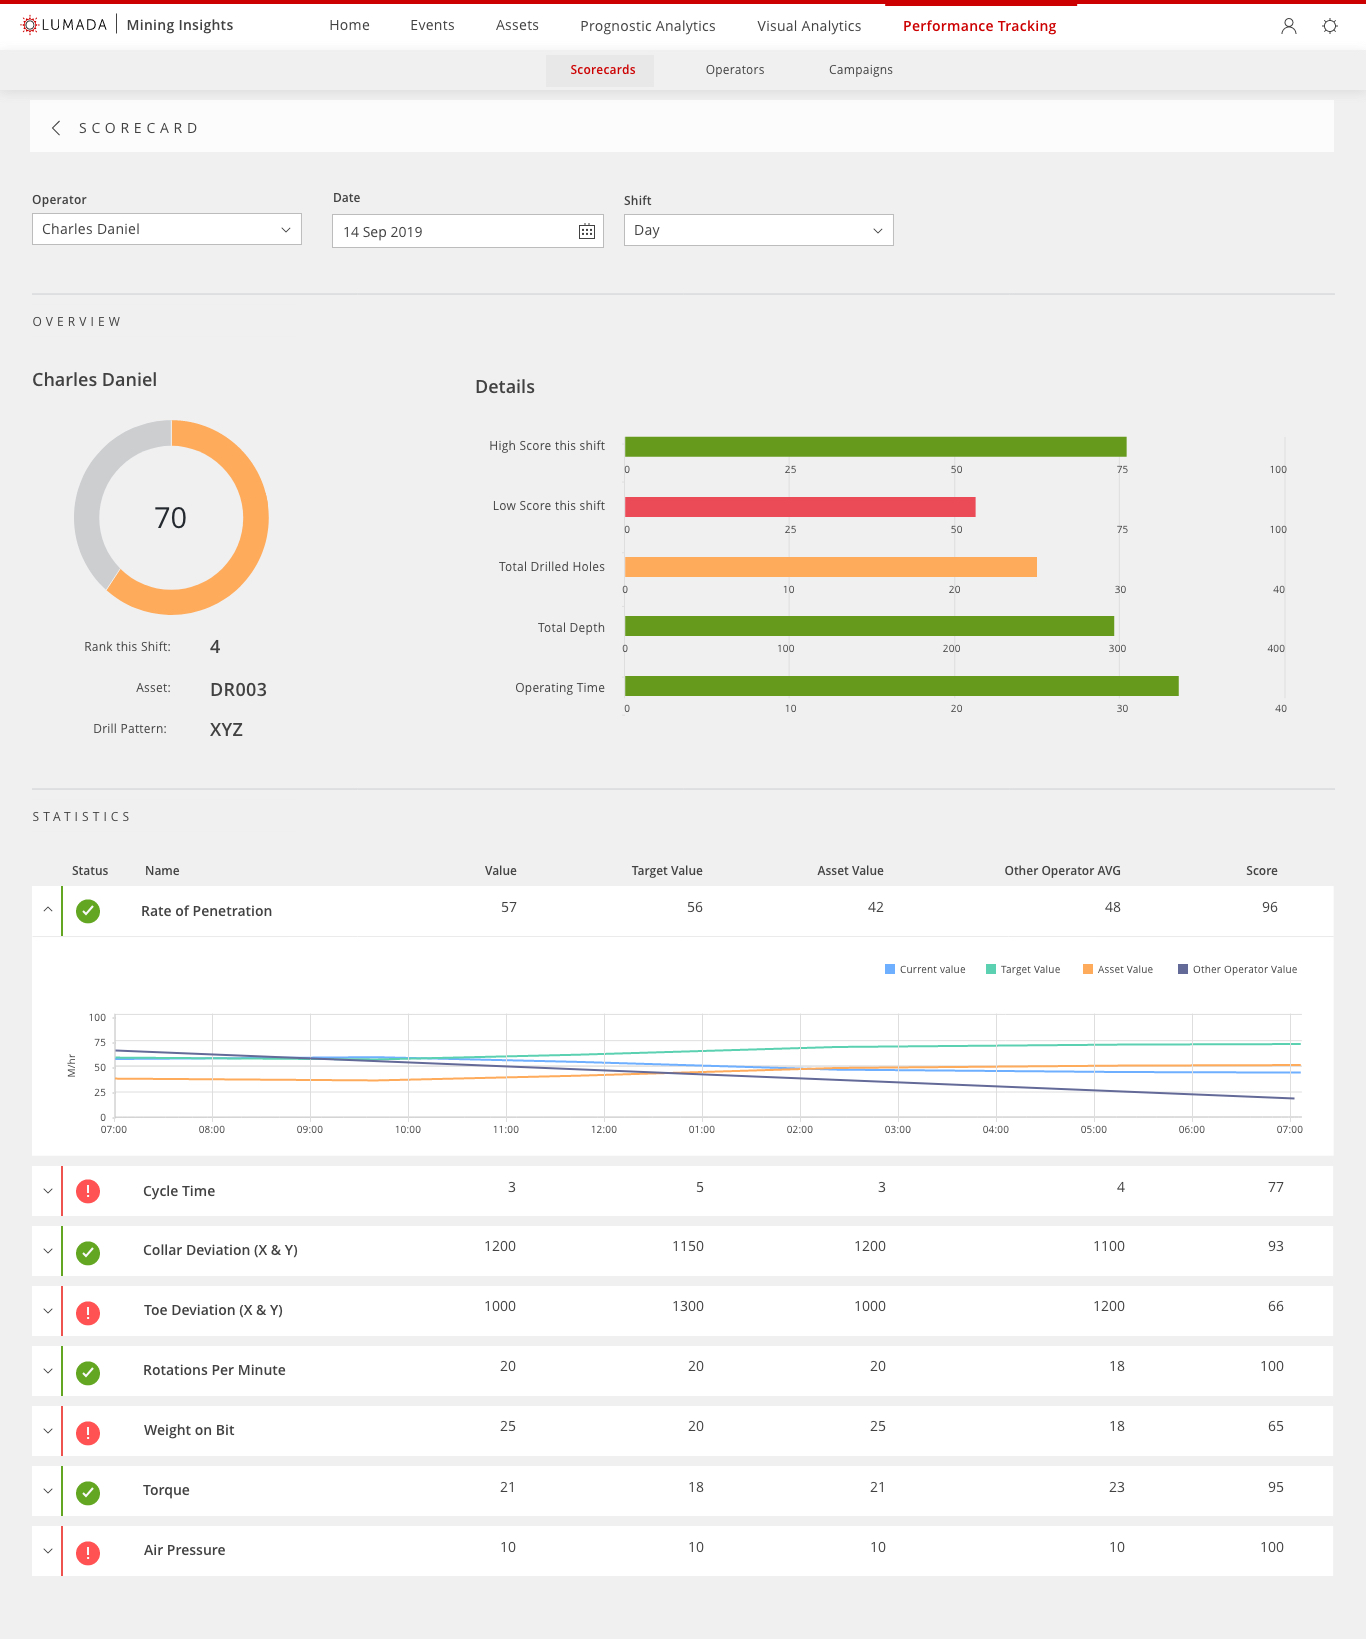
Individual scorecard view
Filter by any date or operator and view scorecard details. Can drill down to main key statistics and see how they compare with other factors.
Conclusion and next steps
As this is a multiyear customer engagement project, there is always room for improvement. As the lead designer I am responsible to advocate for the end users and continue to improve the overall UX. After post launch there are plans to do user testing on this feature and find ways to enhance the overall UX for the application.